

MedFriendly®


Standard Score
A score that has the same
meaning for all individuals
(regardless of age) and
indicates the degree to
which what is being
measured is normal or
abnormal. To understand
why this is needed,
consider the following
scenario. Imagine that the
same 50-item math test
was given two people,
ages 10 and 40.
FEATURED BOOK: Statistics in Plain English
The ten-year-old answered 20 items correct and the 40-year-old answered 25 items
correct. Who did better? We cannot say based on the raw (non-standardized) scores
(i.e., 20 and 25) because we do not know what is normal performance for each age
group. That is, a score of 20 out of 50 might be great for a 10 year old but terrible for a
40 year old. If so, the raw score (20) does not have the same meaning across individuals
in different age groups. This is where standard scores come in. To calculate a standard
score, one needs to know the average score and standard deviation (SD) of the
reference group (in this case, the age group). The standard deviation is a number that
reflects how much scores tend to vary away from the average score in the reference
group.
"Where Medical Information is Easy to Understand"™
The average score (also known as the mean score) and SD are
known in advance. For the example above, assume the mean score
on the math test for ten-year-olds is 19 (SD = 5) and that the mean
score for forty-year-olds is 40 (SD = 7).
The formula for calculating a standard score is as follows: raw score
minus the mean score, divided by the SD. For the ten-year-old, the
calculation is as follows: 20-19, divided by 5, which equals 0.2. For
the forty-year old, the calculation is as follows: 25-40, divided by 7,
which equals -2.14. The resulting standard scores are known as Z
scores. The Z scores provide an indication of how far the score is
away from the normal (average) score of the reference group.
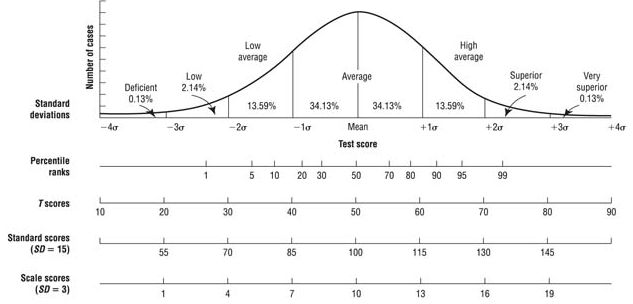
On a Z score scale, a score of 0 is normal and at the 50th percentile. A percentile reflects the percent of
people that one scored better than. So if a score is at the 50th percentile, this means that the score is
better than 50% of people who took the test. At the same time, the scores is also worse than 50% of
people who took the test. Thus, the 50th percentile is directly in the middle. A Z score of +1 is at the 84th
percentile, meaning it is better than 84% of people who took the test. A Z score of -1 is at the 16th
percentile, meaning it is better than only 16% of people who took the test. Thus, 34% of people fall within
one unit (known as a standard deviation) below the mean (i.e., 50-34=16) and 34% of people score one
standard deviation above the mean (50+34=84). To put it another way, 68% of people will obtain a
standard score that is within one standard deviation above or below the mean score.
So lets return to our example. The z score for the 10-year-old is 0.2. This score is at the 58th percentile,
meaning it is better than 58% of other 10-year-olds who took the same math test. This is an average
score. The Z score for the 40-year-old is -2.14. This score is at the 2nd percentile, meaning it is only
better than 2% of other 40-year-olds who took the same math test. In other words, 98% of 40-year-olds
who originally took the math test performed better than this individual. So even though the 40-year old had
a higher raw score than the 10-year-old, the 10-year-olds performance is actually better and the standard
score helps determine this.
Some people take Z scores and convert them to other types of standard scores such as scaled scores, T
scores, or deviation IQ scores. All of these scores can be used interchangeably. As mentioned above, the
50th percentile for a Z score is 0. The 50th percentile for a scaled score is 10, for a T score is 50, and for
a deviation IQ is 100. The standard deviation unit for a Z score is 1, for a scaled score is 3, for a T score
is 10, and for a deviation IQ is 15. To make things more confusing, deviation IQ scores are sometimes
referred to as standard scores but technically, all of the prior scores are standard scores. To see how
these scores are all interchangeable and what the associated percentiles are, please visit the
MedFriendly standard score to percentile conversion table.